Blind Docking
1. Introduction
To get a first taste about the functionalities of LightDock, we will perform an easy-to-start blind docking simulation using The LightDock Server. In the field of docking, blind refers to docking a ligand to the whole surface of a receptor without any prior knowledge of the target interface. In LightDock, you can perform protein-protein, protein-peptide, protein-nucleic acid, nucleic acid-nucleic acid and nucleic acid-peptide, so basically anything but small molecules. For this demonstration, we will be docking a peptide onto an RNA molecule in the absence of any information to guide the simulation (blind), in attempts to recapitulate the structure of 1a4t. See animation below.
2. Protocol
As said before, we will make use of The LightDock Server. Please, download the PDB files for the receptor RNA and the ligand peptide.
The server is built in a way that reduces the complexity of setting up a simulation. However, the steps that follows are exactly the same as if you were using the command line version of LightDock.
Note: You can choose to register in order to get access to a personal workspace or not. You can use every functionality of the server without registration.
2.1. Step 1
First things first. If you decided to register, please Log in. Alternatively, you can head to Submit a new run ». Choose a name for your run (e.g. EMBO2023-RNA_fantasy) and upload your receptor and ligand PDB files. Once you are set, click on Next Step.
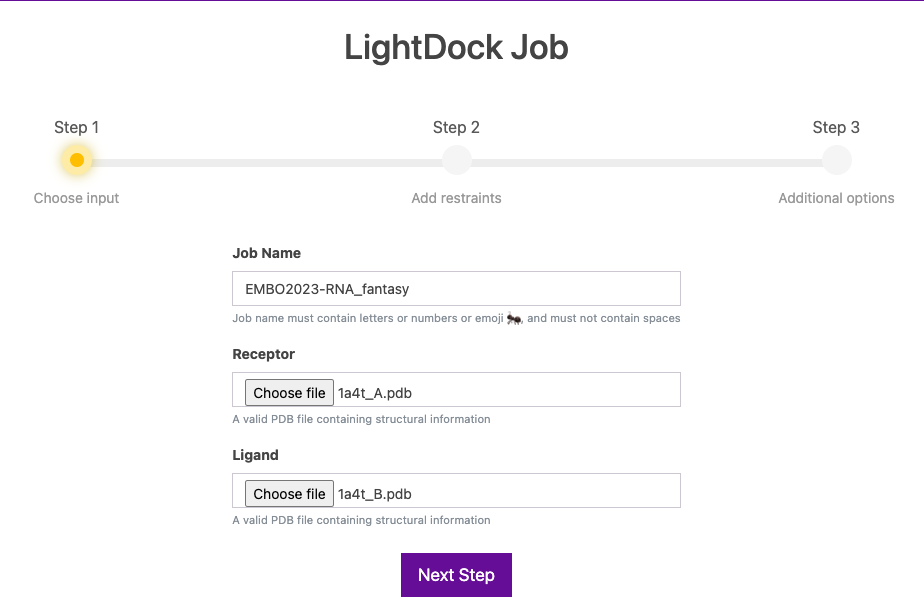
Step 1
2.2. Step 2
In this screen, we can visualize the molecules, and make sure that these are indeed the correct ones. Also, we can specify few things:
-
Molecule type. Options are: Protein, Membrane protein, Antibody and Nucleic. In this case, the server automatically detects Nucleic for the receptor and Protein for the ligand. Specifying these types is required for correctly activating the different dedicated modeling modes of the server.
-
Active Residue Restraints. These boxes are the place for specifying any kind of information that you may want to use during the simulation. The active terms refers to the fact that the information will be used at both the setup and simulation steps. Notation must be A.1, where A refers to the chain ID and 1 to the residue number. Leave them blank for this example.
Click on Next Step
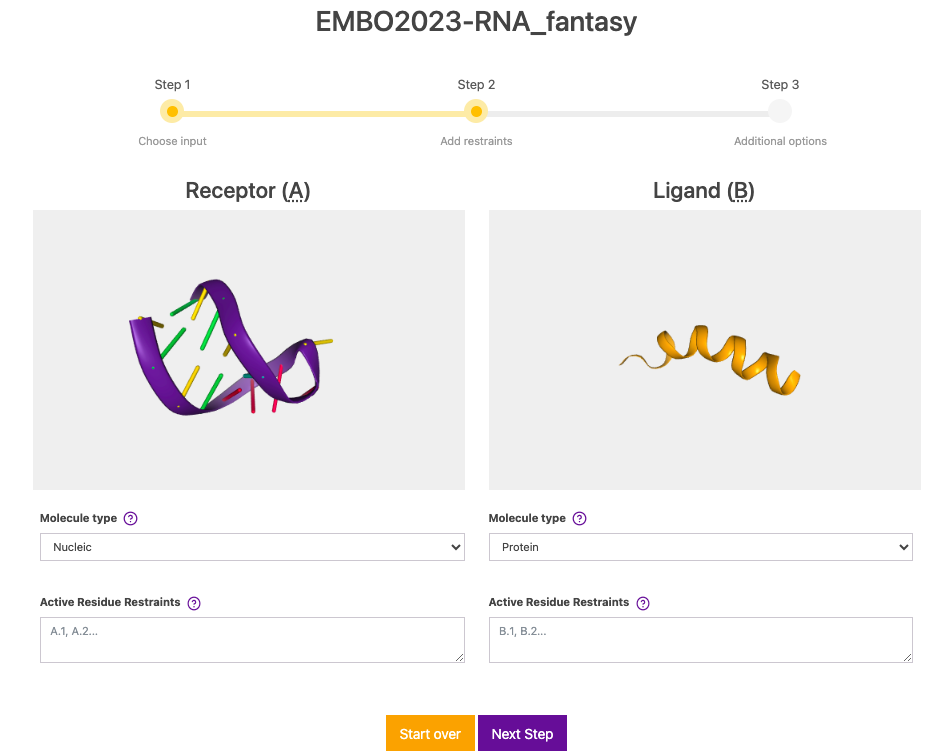
Step 2
2.3. Step 3
Finally, in this screen you can fine-tune a bit more your simulation. You can choose to minimize (or not) the resulting top 5/10 models. Please note that this option only apply when both of your molecules are proteins, including peptides, membrane or antibodies. As you see, the minimization option for this specific example is disabled by default.
Also, you can enable flexibility using Anisotropic Network Model (ANM) and the number normal modes. By default, LightDock considers the first 10 non-trivial modes. Here, ANM is not supported for nucleic but you could activate it for the peptide. Once you are all set, click on Submit Job.
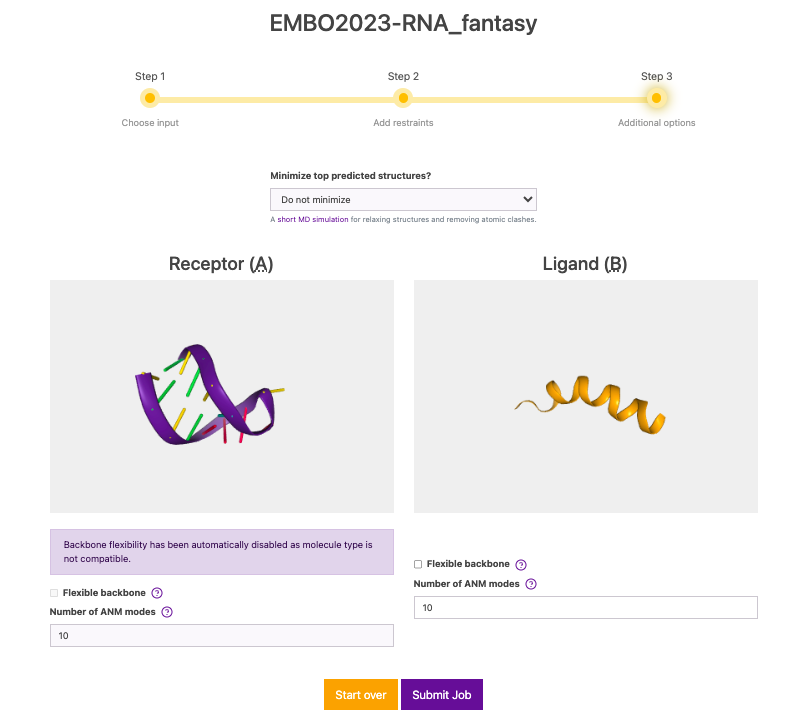
Step 3
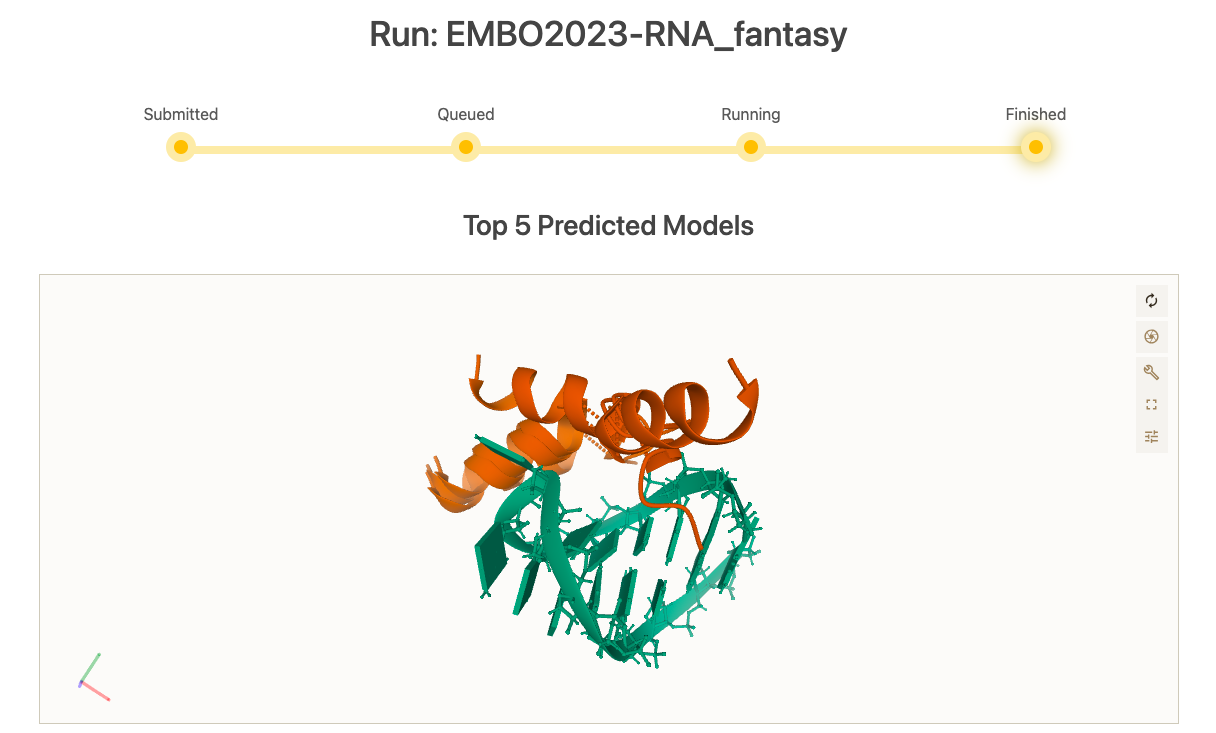
3. Results
Once the simulation finishes, the top 5 models according to their scores are displayed in an interactive (PyMOL-like) interface. By definition, a blind simulation in LightDock will perform an exhaustive sampling over the entire receptor’s surface. Here, we can notice that the simulation has converged towards an specific region of the RNA molecule. See picture below for details.
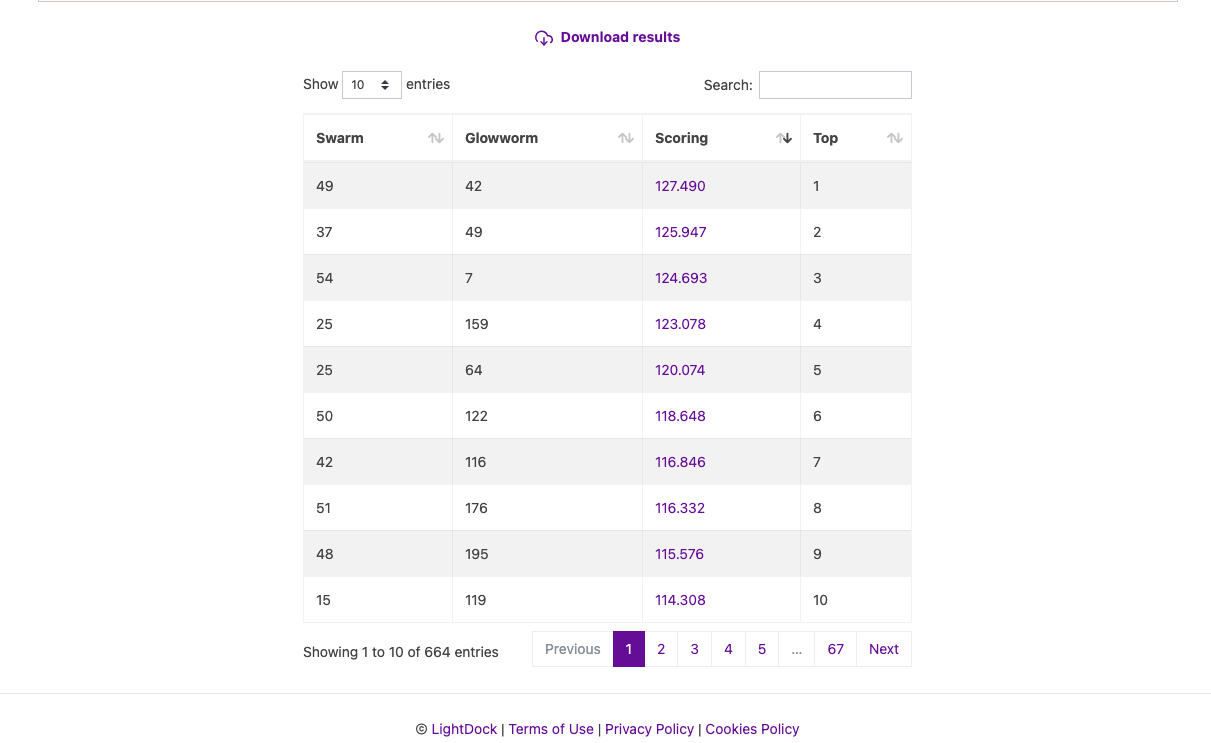
In the scoring table, we can find information for each specific model, such as swarm and glowworm numbers, score and position on the ranking (refer as Top based on Scoring). Moreover, this table is searchable and you sort it by any of the items before mentioned. Also, you can either download the full run or any of the models individually.
If we look at the scores of the top models, we see that there are no significant differences between them, which, to some extent, might make sense since they recapitalute rather similar interfaces. See picture below for details.
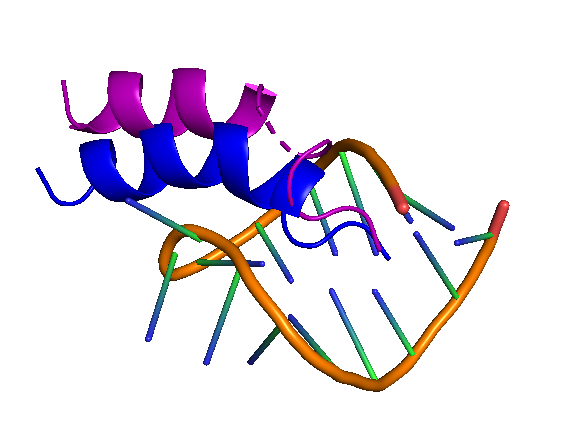
4. Analysis
The motivation of this test was to see whether the blind protocol of LightDock was able to recapitulate the structure of 1a4t. A fast analysis that we can do is to indeed compare some of the top ranked models of LightDock to the experimentally solved structure. (reference). Below, you can see the comparison between the reference (blue) and a LightDock model (purple).
Here, you can check the results of the simulation.